Additional programs
When you conda install flair, the following helper programs will be in your $PATH:
diff_iso_usage
usage: diff_iso_usage counts_matrix colname1 colname2 diff_isos.txt
Requires four positional arguments to identify and calculate
significance of alternative isoform usage between two samples using
Fisher’s exact tests: (1) counts_matrix.tsv from flair-quantify, (2) the
name of the column of the first sample, (3) the name of the column of
the second sample, (4) txt output filename containing the p-value
associated with differential isoform usage for each isoform. The more
differentially used the isoforms are between the first and second
condition, the lower the p-value.
Output file format columns are as follows:
gene name
isoform name
p-value
sample1 isoform count
sample2 isoform count
sample1 alternative isoforms for gene count
sample2 alternative isoforms for gene count
diffsplice_fishers_exact
usage: diffsplice_fishers_exact events.quant.tsv colname1 colname2 out.fishers.tsv
Identifies and calculates the significance of alternative splicing
events between two samples without replicates using Fisher’s exact
tests. Requires four positional arguments: (1) flair-diffSplice tsv
of alternative splicing calls for a splicing event type, (2) the name of
the column of the first sample, (3) the name of the column of the second
sample, and (4) tsv output filename containing the p-values from
Fisher’s exact tests of each event.
Output
The output file contains the original columns with an additional column containing the p-values appended.
fasta_seq_lengths
usage: fasta_seq_lengths fasta outfilename [outfilename2]
junctions_from_sam
Usage: junctions_from_sam [options]
Options:
  -h, --help           show this help message and exit
  -s SAM_FILE          SAM/BAM file of read alignments to junctions and
                       the genome. More than one file can be listed,
                       but comma-delimited, e.g file_1.bam,file_2.bam
  --unique             Only keeps uniquely aligned reads. Looks at NH
                       tag to be 1 for this information.
  -n NAME              Name prefixed used for output BED file.
                       Default=junctions_from_sam
  -l READ_LENGTH       Expected read length if all reads should be of
                       the same length
  -c CONFIDENCE_SCORE  The mininmum entropy score a junction
                       has to have in order to be considered
                       confident. The entropy score =
                       -Shannon Entropy. Default=1.0
  -j FORCED_JUNCTIONS  File containing intron coordinates
                       that correspond to junctions that will be
                       kept regardless of the confidence score.
  -v                   Will run the program with junction strand ambiguity
                       messages
mark_intron_retention
usage: mark_intron_retention in.psl|in.bed out_isoforms.psl out_introns.txt
Assumes the psl has the correct strand information
Requires three positional arguments to identify intron retentions in isoforms:
pslof isoforms
psloutput filename
txtoutput filename for coordinates of introns found.
Outputs
an extended
pslwith an additional column containing either values 0 or 1 classifying the isoform as either spliced or intron-retaining, respectively
txtfile of intron retentions with formatisoform namechromosomeintron 5' coordinateintron 3' coordinate.
Note: A psl or bed file with more additional columns will not be displayed in the UCSC genome browser, but can be displayed in IGV.
mark_productivity
usage: mark_productivity reads.psl annotation.gtf genome.fa > reads.productivity.psl
normalize_counts_matrix
usage: normalize_counts_matrix matrix outmatrix [cpm/uq/median] [gtf]
Gtf if normalization by protein coding gene counts only
plot_isoform_usage
plot_isoform_usage <isoforms.psl>|<isoforms.bed> counts_matrix.tsv gene_name
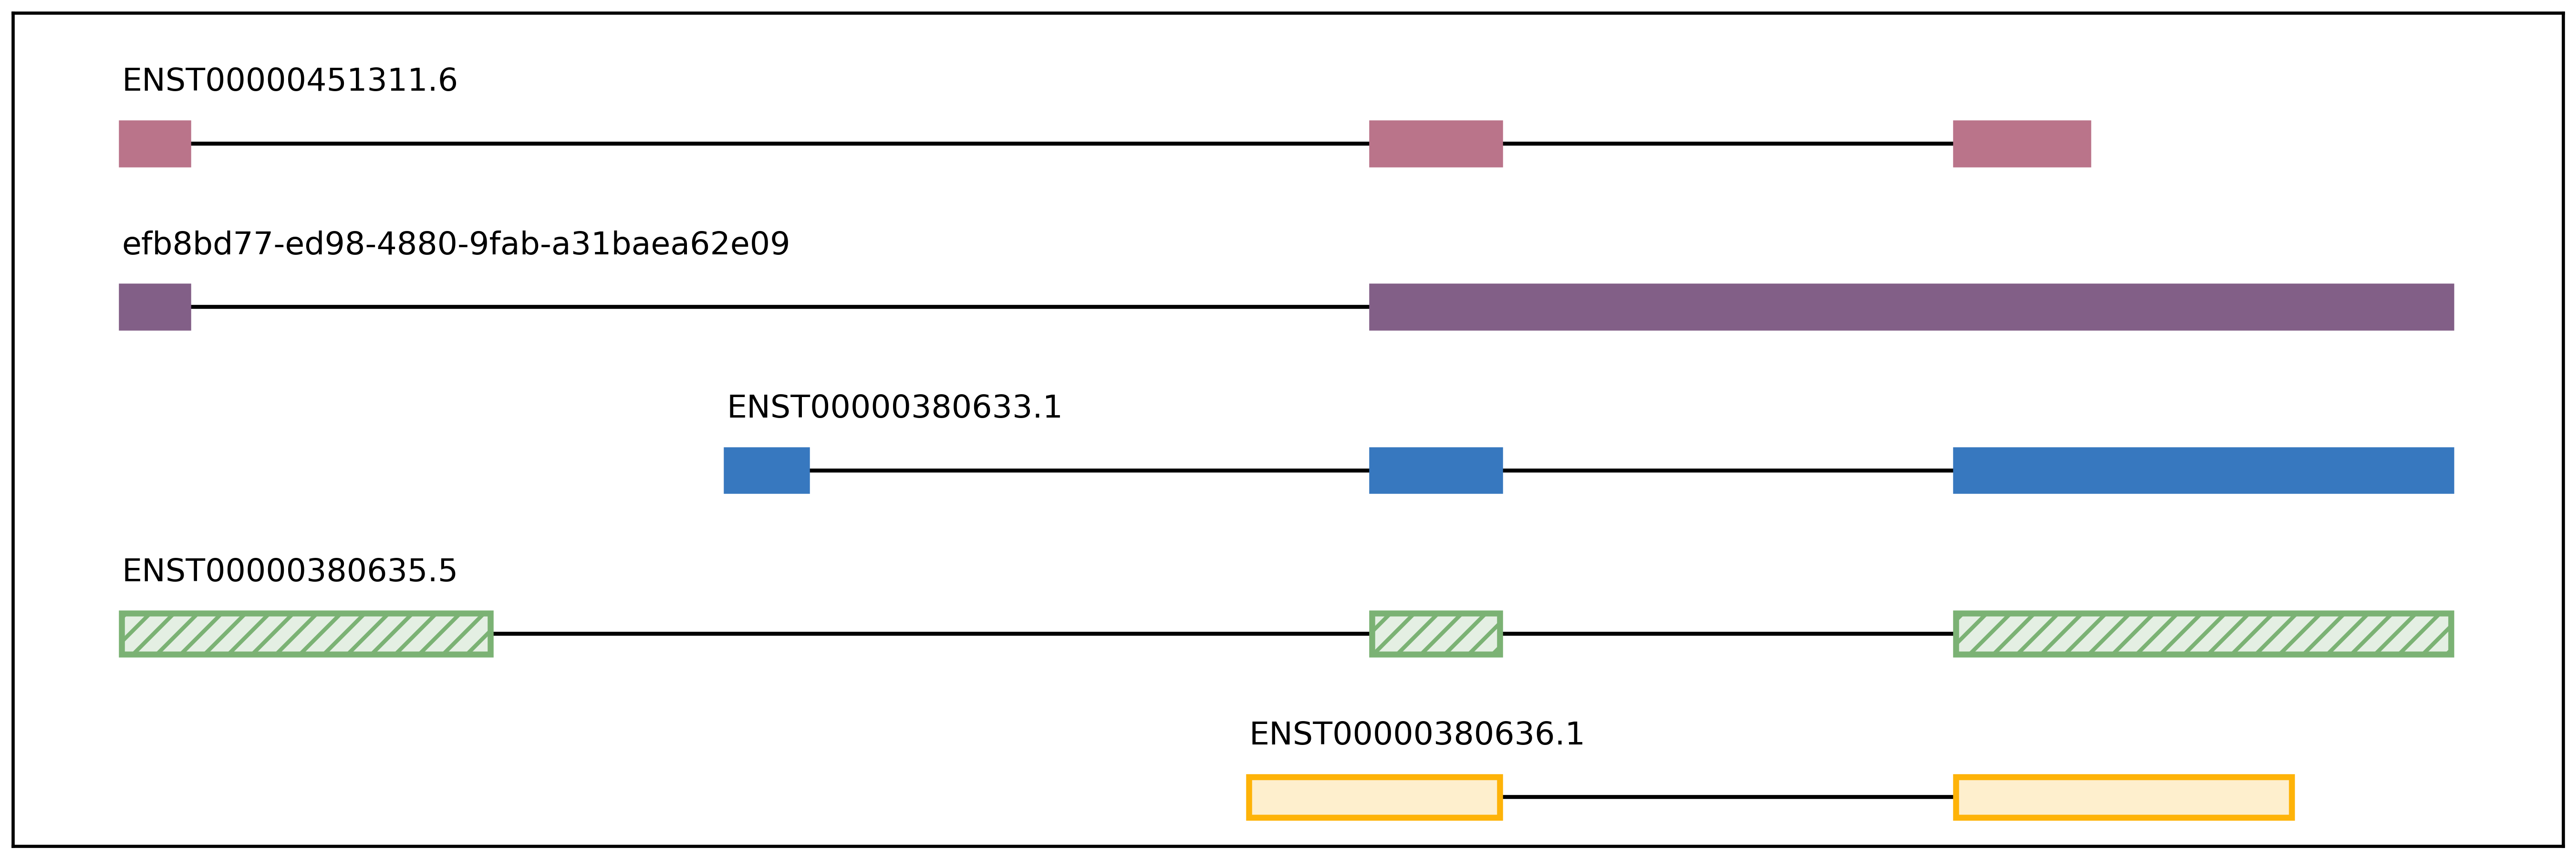
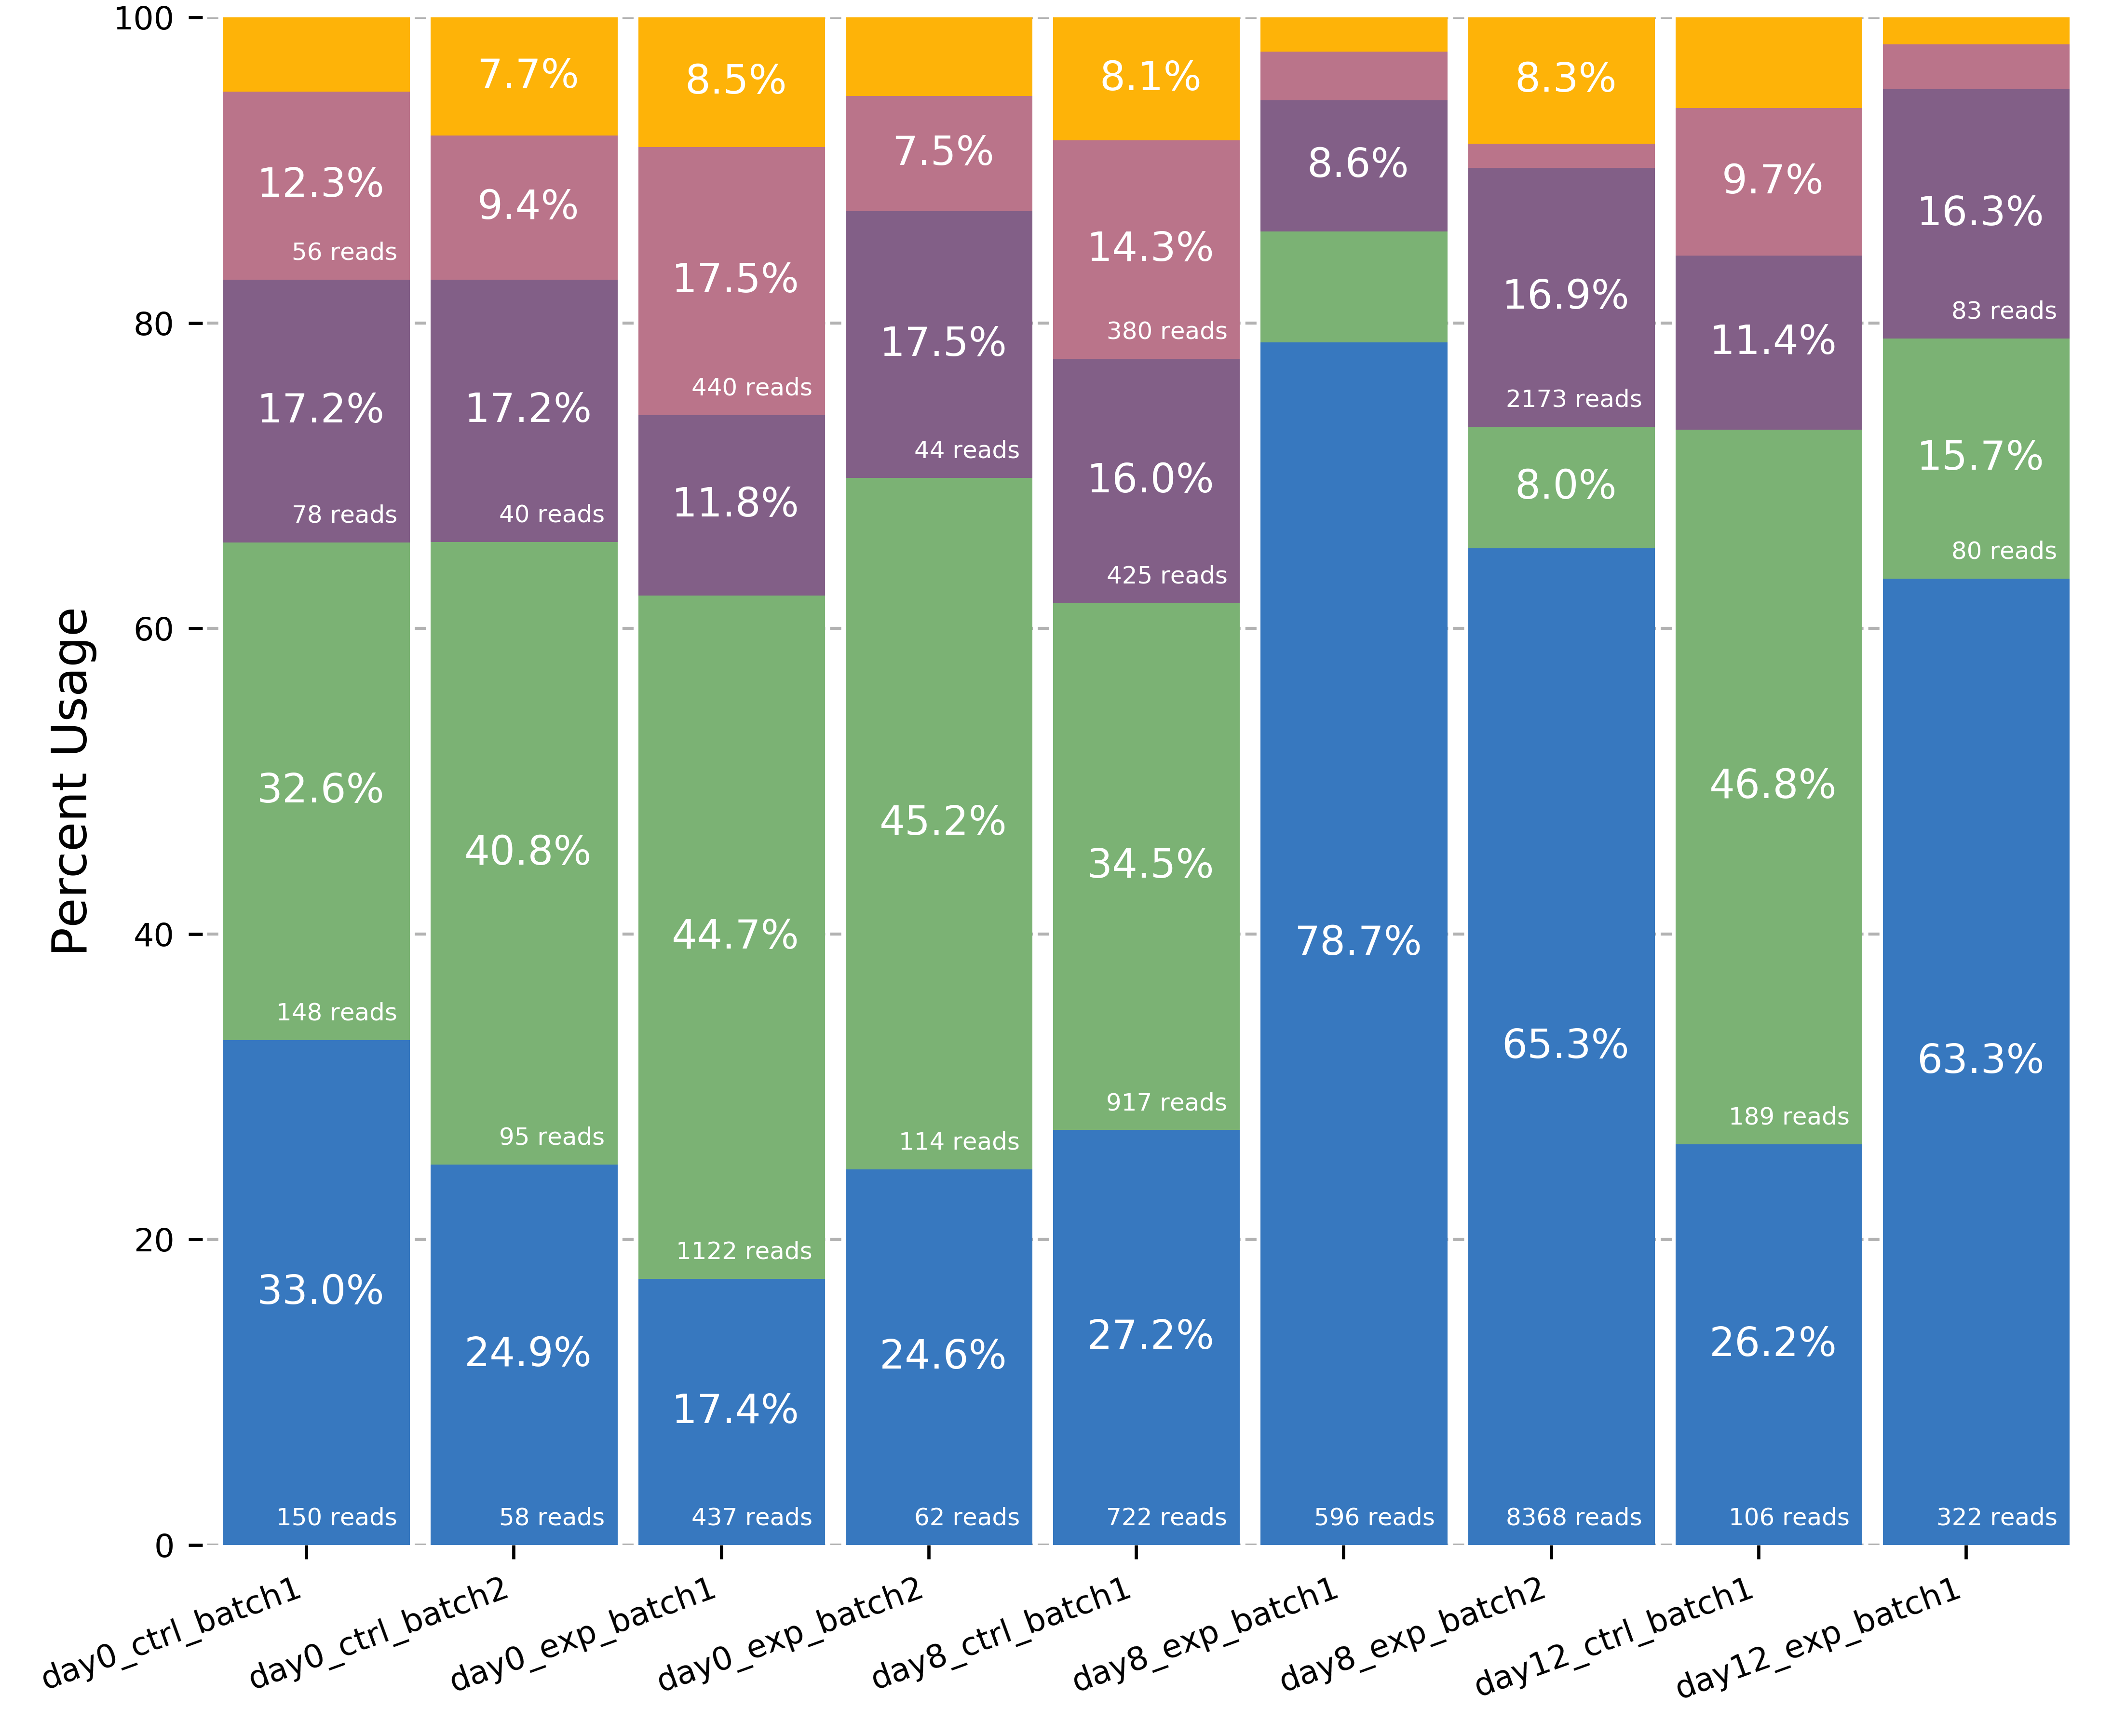
Visualization script for FLAIR isoform structures and the percent usage
of each isoform in each sample for a given gene. If you supply the
isoforms.bed file from running predictProductivity, then isoforms
will be filled according to the predicted productivity (solid for
PRO, hatched for PTC, faded for NGO or NST). The gene
name supplied should correspond to a gene name in your isoform file and
counts file.
The script will produce two images, one of the isoform models and another of the usage proportions.
The most highly expressed isoforms across all the samples will be plotted.
The minor isoforms are aggregated into a gray bar. You can toggle min_reads or color_palette to plot more isoforms. Run with –help for options
Outputs
gene_name_isoforms.png of isoform structures
gene_name_usage.png of isoform usage by sample
For example:


positional arguments:
  isoforms              isoforms in psl/bed format
  counts_matrix         genomic sequence
  gene_name             Name of gene, must correspond with the gene names in
                        the isoform and counts matrix files

options:
  -h, --help            show this help message and exit
  -o O                  prefix used for output files (default=gene_name)
  --min_reads MIN_READS
                        minimum number of total supporting reads for an
                        isoform to be visualized (default=6)
  -v VCF, --vcf VCF     VCF containing the isoform names that include each
                        variant in the last sample column
  --palette PALETTE     provide a palette file if you would like to visualize
                        more than 7 isoforms at once or change the palette
                        used. each line contains a hex color for each isoform
predictProductivity
usage: predictProductivity -i isoforms.bed -f genome.fa -g annotations.gtf
Annotated start codons from the annotation are used to identify the
longest ORF for each isoform for predicting isoform productivity.
Requires three arguments to classify isoforms according to productivity:
(1) isoforms in psl or bed format, (2) gtf genome
annotation, (3) fasta genome sequences. Bedtools must be in your
$PATH for predictProductivity to run properly.
Output
Outputs a bed file with either the values PRO (productive), PTC
(premature termination codon, i.e. unproductive), NGO (no start
codon), or NST (has start codon but no stop codon) appended to the
end of the isoform name. When isoforms are visualized in the UCSC genome
browser or IGV, the isoforms will be colored accordingly and have
thicker exons to denote the coding region.
options:
  -h, --help            show this help message and exit
  -i INPUT_ISOFORMS, --input_isoforms INPUT_ISOFORMS
                        Input collapsed isoforms in psl or bed12 format.
  -g GTF, --gtf GTF     Gencode annotation file.
  -f GENOME_FASTA, --genome_fasta GENOME_FASTA
                        Fasta file containing transcript sequences.
  --quiet               Do not display progress
  --append_column       Append prediction as an additional column in file
  --firstTIS            Defined ORFs by the first annotated TIS.
  --longestORF          Defined ORFs by the longest open reading frame.
File conversion scripts
bam2Bed12
usage: bam2Bed12 -i sorted.aligned.bam
options:
  -h, --help            show this help message and exit
  -i INPUT_BAM, --input_bam Input bam file.
  --keep_supplementary  Keep supplementary alignments
A tool to convert minimap2 BAM to Bed12.
bed_to_psl
usage: bed_to_psl chromsizes bedfile pslfile
chromsizes is a tab separated file of chromosome sizes, needed to make the psl file genome browser compatible. Here is one for GRCh38/hg38.
psl_to_bed
usage: psl_to_bed in.psl out.bed
sam_to_map
usage: sam_to_map sam outfile